💾 Low-Tech Mode Available
Can’t view the full experience properly? Click [here] for the static version.
Can’t view the full experience properly? Click [here] for the static version.
BREAKING DOWN THE NUMBERS BEHIND THE LOOKS
OVERVIEW
As a big fan of Beyoncé’s Renaissance album and tour, I wanted to create a project that combined my love of fashion, Beyoncé, and data.
ROLE
Responsible for research and design of the feature. Prototyped micro-interactions.


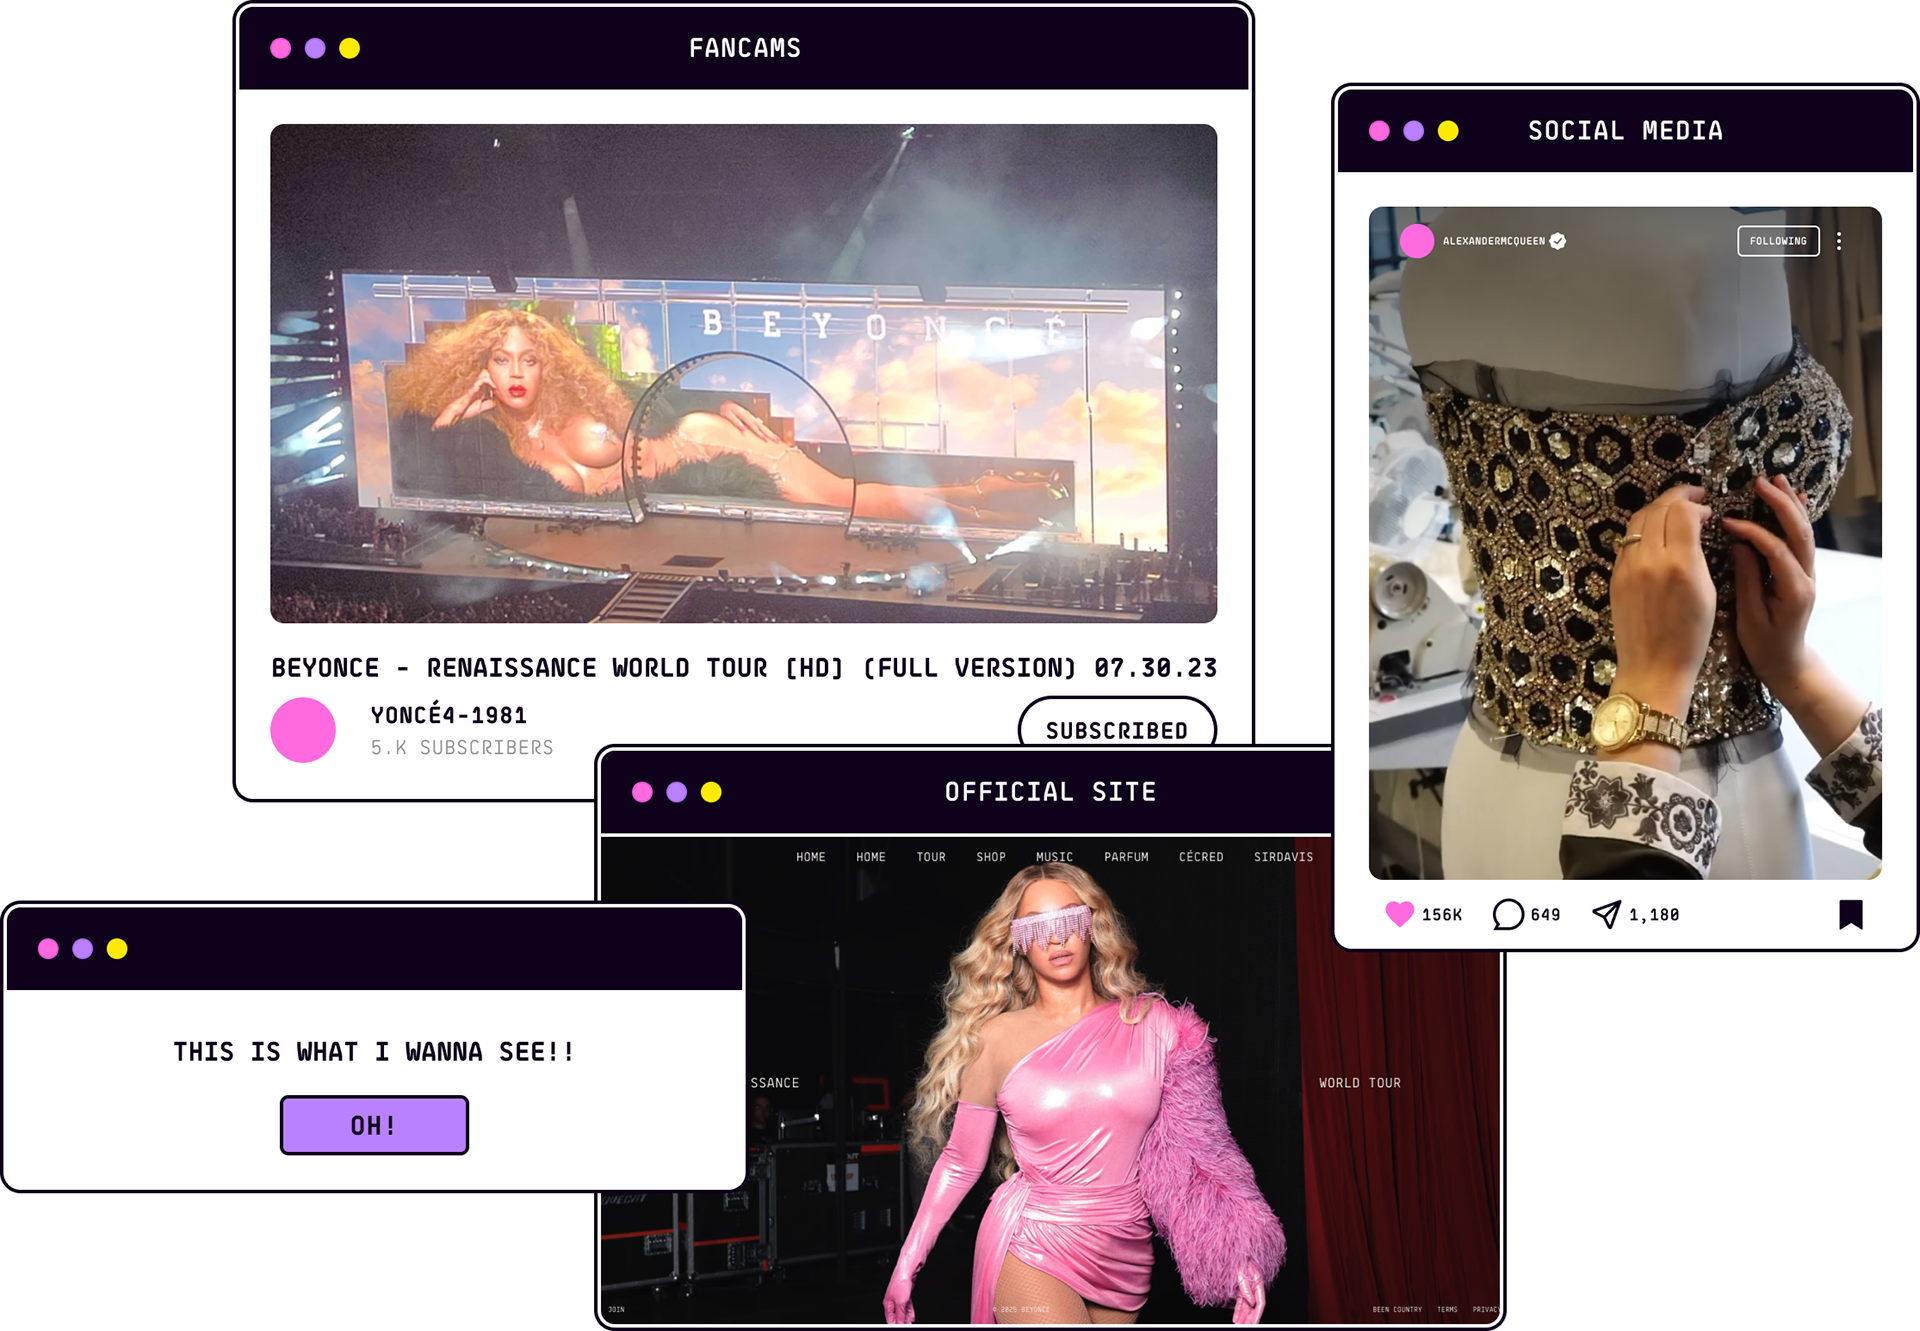
Outfits were manually tracked using a mix of fancam recordings, live streams, and day-by-day official photos from Beyoncé’s website. Designer and stylist credits were cross-referenced through their social media pages and verified fashion publications. Only designers confirmed by either their own platforms or through collaborating stylists were credited, ensuring accuracy throughout the dataset.

For my data, I wanted to highlight the sheer scale of designs used, so I categorized the data by designer, stylists, frequency of appearance, description, and debut.
The data can be viewed in full [HERE]


* My final dataset revealed 152 unique looks, from over 85 designers.
* Balmain and Ivy Park contributed the most individual designs to the tour, with a total of 10 designs each. Beyoncé debuts an average of 4 new looks per tour date.

I used a combination of pictographs, bar charts, bubble charts, interactive elements, and an exploratory tool to evoke the fun and futuristic world of the Renaissance tour while calling back to the visual language used in the branding of the album. I decided to add more color, inspired by the colorful dance floor of a 1970s disco.


1. Lessons in Data Collection & Attribution
This project is the first time I’ve had to collect data, organize it, and figure out how to present it in a way that was easy to understand to anyone coming across it. I learned a lot while researching, mainly when it came to sourcing. This was important for the data since I counted garments and made sure I was attributing the correct credits to each designer.
I decided to only give credit when it was posted directly through a designer’s social media or website, making sure I rarely relied on tertiary sources. I also learned how to categorize data.

2. Refining Data Classification & Visualization
Organizing dozens of garments required a clear system of data classification. When a costume appeared again in the same silhouette but a different color, it was labeled as a variant with a new number.
If elements were removed or altered, however, it was categorized as a modified version of the original rather than an entirely new look.
When designing, I determined which chart taxonomy best represented the data I wanted to convey, the number of looks each designer contributed.
